
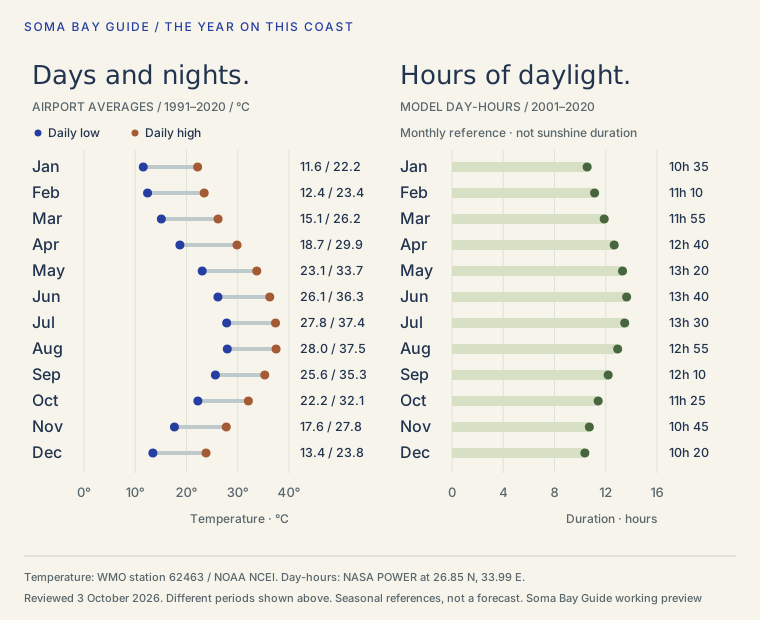
For a longer stay, think beyond the month on the booking. Compare the daily highs and lows, the amount of daylight and the routine you want: school mornings, a working day, an afternoon outside or dinner after dark. The charts above give you a seasonal reference. They cannot tell you what the weather will be on your arrival date.
Read the two charts differently
The temperature chart uses Hurghada Airport’s 1991–2020 station normals, supplied through the WMO archive held by NOAA NCEI. Each low and high is an average of daily minima or maxima for that calendar month. The line between them is not a promise that temperatures stay within it. Hurghada Airport is a regional reference, not a weather station at your Somabay home.
The daylight chart uses NASA POWER’s 2001–2020 day-hours reference at a point around Soma Bay. It describes the average hours when solar irradiance is present, displayed here to the nearest five minutes. It is not a measure of uninterrupted bright sunshine, and it gives no clock time for sunrise or sunset. Use it to compare the broad seasonal shape, rather than to set an appointment or a transfer.
The records have different periods. We keep both labels visible because combining them under one date would disguise that difference. Neither series provides a forecast, sea temperature, local wind, beach-access permission or a measure of conditions inside a home.
Plan the home and the household week
Before a warmer-month return, have the rooms you will actually use checked, including the air conditioning and its controls. Agree who will deal with a fault before guests arrive. If you work from home, test the connection at the desk, rather than treating Wi-Fi and cooling as two boxes on a rental advert.
Before a cooler-month return, ask which rooms have heating, how it is operated and whether the hot-water setup is ready. Do not assume that every air-conditioning unit also heats. Use the property’s equipment instructions. For someone else preparing the home, the handover worksheet records what was checked, what is merely booked and what remains unresolved.
For school runs, repairs and errands, plan around the actual appointment and journey. Day-hours are not opening hours. Confirm the business, transport and entry arrangements separately; an extra hour in the seasonal daylight reference does not establish an extra shuttle, an open shop or access to a hotel.
Match the guest’s plans to the particular facilities
Ask guests what they expect to do. A beach afternoon, a dive, a round of golf and time beside a pool need different arrangements. Air temperatures alone do not establish water conditions or whether a particular pool is heated. Ask the relevant operator about the session or facility for the dates in question, including any weather-related cancellation or alternative.
Keep the facility-access check separate from choosing the season. Permission to enter the peninsula does not settle the use of a neighbouring hotel, beach or pool. Put the exact venue, entrance and return journey in the guest arrival sheet.
For a longer working stay, organise the indoor fallback before filling the diary with outdoor plans. For an owner expecting several visits, use the comparison to notice the change between those months, then update the home handover for each arrival. The chart is a prompt for that conversation, not a destination-wide operating calendar.
Sources, periods and saved copies
Temperature: WMO station 62463, Hurghada Airport. The station file identifies its position and elevation; the series uses monthly mean daily low, high and mean temperatures for 1991–2020. We read the full CSV in NOAA’s immutable archive version 4.4. The archive access link on the overview page was looping during this review, so the direct file address is retained in the source panel and download. No local temperature correction is applied.
Day-hours: NASA POWER parameter DAY_HOURS, using the stated 2001–2020 period at 26.85° N, 33.99° E. A trial request for 1991–2020 returned a parameter-specific warning that the day-hours series still covered 2001–2020. The published request and label use that actual period. The parameter definition is retained with the research.
Review date: 3 October 2026 is when these sources were read. It does not move the temperature record beyond 2020 or make the figures live weather. Source publication dates are not stated and remain unknown. The interpretation and planning questions are the guide’s editorial work; no home, activity or service was tested for this page.
Save the original SVG chart or the CSV figures above for use without a connection. The CSV retains both reference periods, the station name and the source links. The chart and figures are a separate companion to the 42-page field edition; that dated edition has not been rewritten to include this addition. External source links still require internet.
Sources & dates 6 published sources
- Hurghada Airport: WMO 1991–2020 station normals
WMO member-country submission / NOAA NCEI · Source date not stated · Retrieved 3 Oct 2026
Station 62463 is Hurghada Airport, not Somabay. Daily high/low means are averages, not extremes or forecasts. Immutable archive version 4.4 inspected; CSV publication date not stated.
- WMO climate normals: parameters and 30-year reference periods
NOAA NCEI · Source date not stated · Retrieved 3 Oct 2026
Method and dataset overview; this page does not establish a local Somabay station.
- NASA POWER: day-hours reference, 2001–2020
NASA POWER · Source date not stated · Retrieved 3 Oct 2026
DAY_HOURS covers 2001–2020. Model/reference point at 26.85 N, 33.99 E; not measured sunshine, clock sunrise/sunset or a forecast.
- NASA POWER climatology parameter definitions
NASA POWER · Source date not stated · Retrieved 3 Oct 2026
DAY_HOURS is the climatological average number of hours when solar irradiance is present. Temperature maximum/minimum parameters differ from daily maximum/minimum averages.
- NASA POWER climatology API: reference periods and point requests
NASA POWER · Source date not stated · Retrieved 3 Oct 2026
Method only. The returned parameter period takes precedence over the requested years; a trial DAY_HOURS request for 1991–2020 returned a 2001–2020 parameter warning and is not used.
- Egypt WMO normals submission: station list and archive notes
NOAA NCEI / WMO · Source date not stated · Retrieved 3 Oct 2026
Egypt entry, page 13 of the linked regional notes: eleven CSV station files; NCEI computed absent primary annual normals from available monthly values. Our chart uses monthly values only.